Scientific Figures
Redrawing a Blurry Bar Chart as an Editable Vector Figure
A low-resolution grouped bar chart rebuilt as a sharp, fully editable vector figure with clean text, aligned bars and labeled values.
- Type of work
- Chart redrawing
- Delivered
- Editable vector figure, plus the file types your journal asks for
- Made for
- Papers, theses, reports and presentations
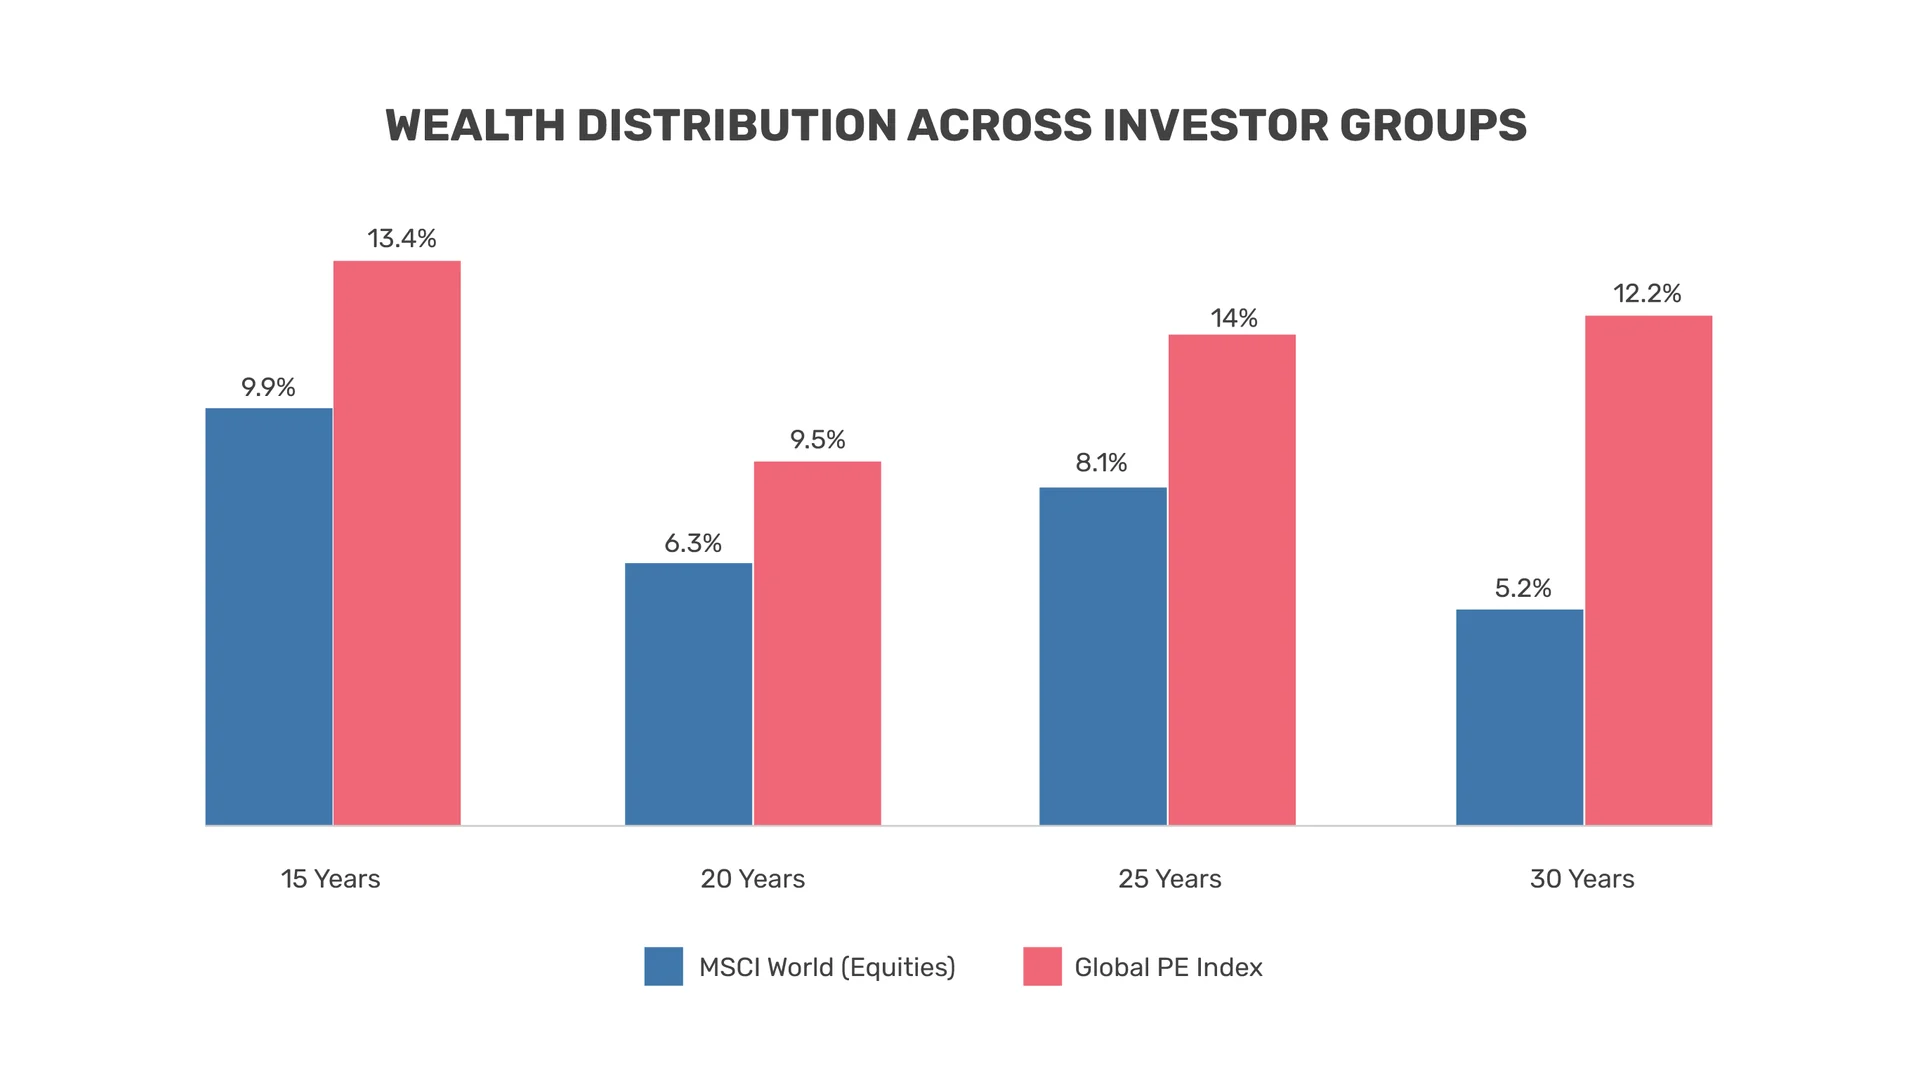
A common problem for authors: the chart only exists as a small, soft image. It looks fine on a screen, but it turns blurry in print, and a journal or publisher asks for something sharper. Enlarging the image does not help, because the pixels are already fixed. The fix is to rebuild the chart as a vector.
Before: a low-resolution chart
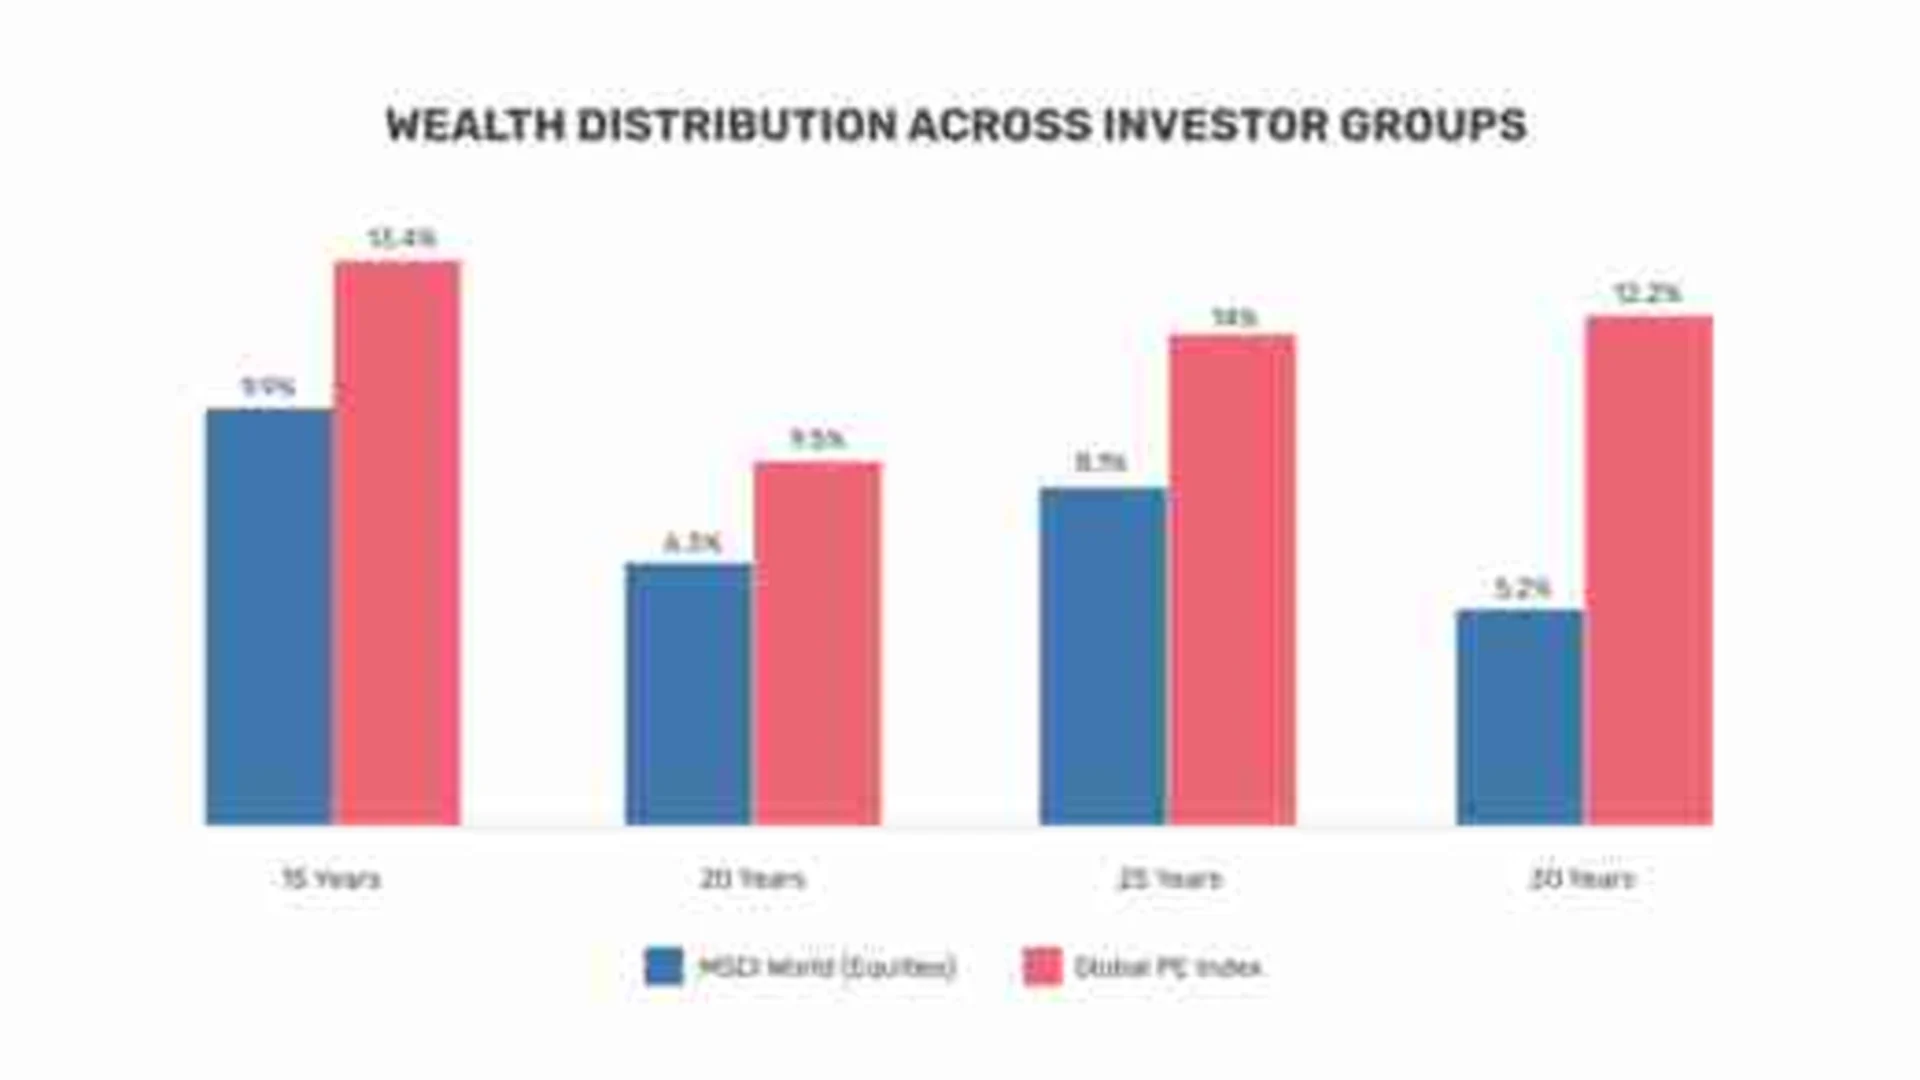
After: the redrawn vector figure
What changed
- All text is rebuilt as live, sharp type in a consistent font
- Bars, axes and groups are aligned and evenly spaced
- The value on each bar is labeled clearly
- The two data series use consistent colors with a clean legend
- Everything is editable, so you can change a color, a label or a size later
Your numbers stay the same
I redraw your figure faithfully and do not change your data. If I notice a possible error, I will tell you.
What you receive
An editable vector figure, plus the file types your journal asks for.
Have a blurry chart? Send it to me with the journal name and I will reply with a quote and timeline.